Motivation
This project came through freelance consulting work. The goal was to make sense of demographic distribution data across cities in Minnesota — surfacing patterns that would be meaningful to a non-technical audience and useful for publication.
Implementation
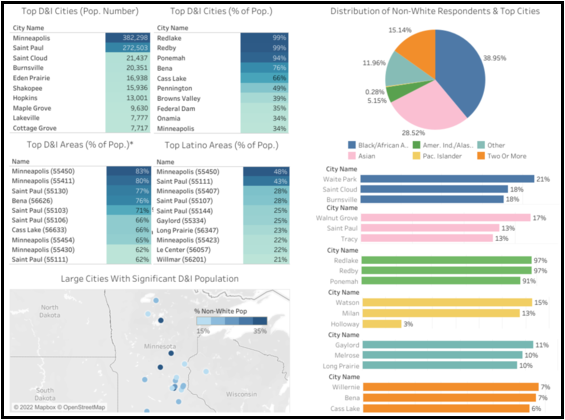
Working with the underlying dataset, I built a set of Tableau visualizations breaking down racial demographic distribution by city. A summary dashboard pulled out the key takeaways: top-ranked cities by raw population counts and by proportional representation relative to overall city size. The deliverables were designed to be readable and self-explanatory without additional context.
Tools & Technologies
Python Tableau